Between the Lines - Process Before Outcome
When Process Comes First


During my morning ritual, while reading the Bhagavad Gita, one verse stayed with me a little longer than usual:
yoga-sthaḥ kuru karmāṇi
saṅgaṁ tyaktvā dhanañ-jaya
siddhy-asiddhyoḥ samo bhūtvā
samatvaṁ yoga ucyate
“Perform your duty with balance, without attachment to success or failure.
Such equanimity is called yoga.” B.G.2.48
It made me pause.
In investing, we often talk about outcomes - returns, winners, mistakes.
But rarely do we sit with the idea of doing the work without obsessing over the result.
At its best, investing is not about being right. It is about showing up every day, doing the work honestly, and letting time do the rest.
Every day, markets shout results. Prices move. Narratives form. Opinions harden.
But the real work happens quietly -
Reading numbers, observing behaviour, and letting patterns reveal themselves over time.
This edition of Between the Lines is an attempt to practice that verse, not just quote it.
We begin with a simple scan - not to reach conclusions, but to surface signals:
newly listed businesses,
stocks trading close to their 52-week highs,
and companies delivering more than 20% YoY PAT growth after reporting Q3 FY26 results.
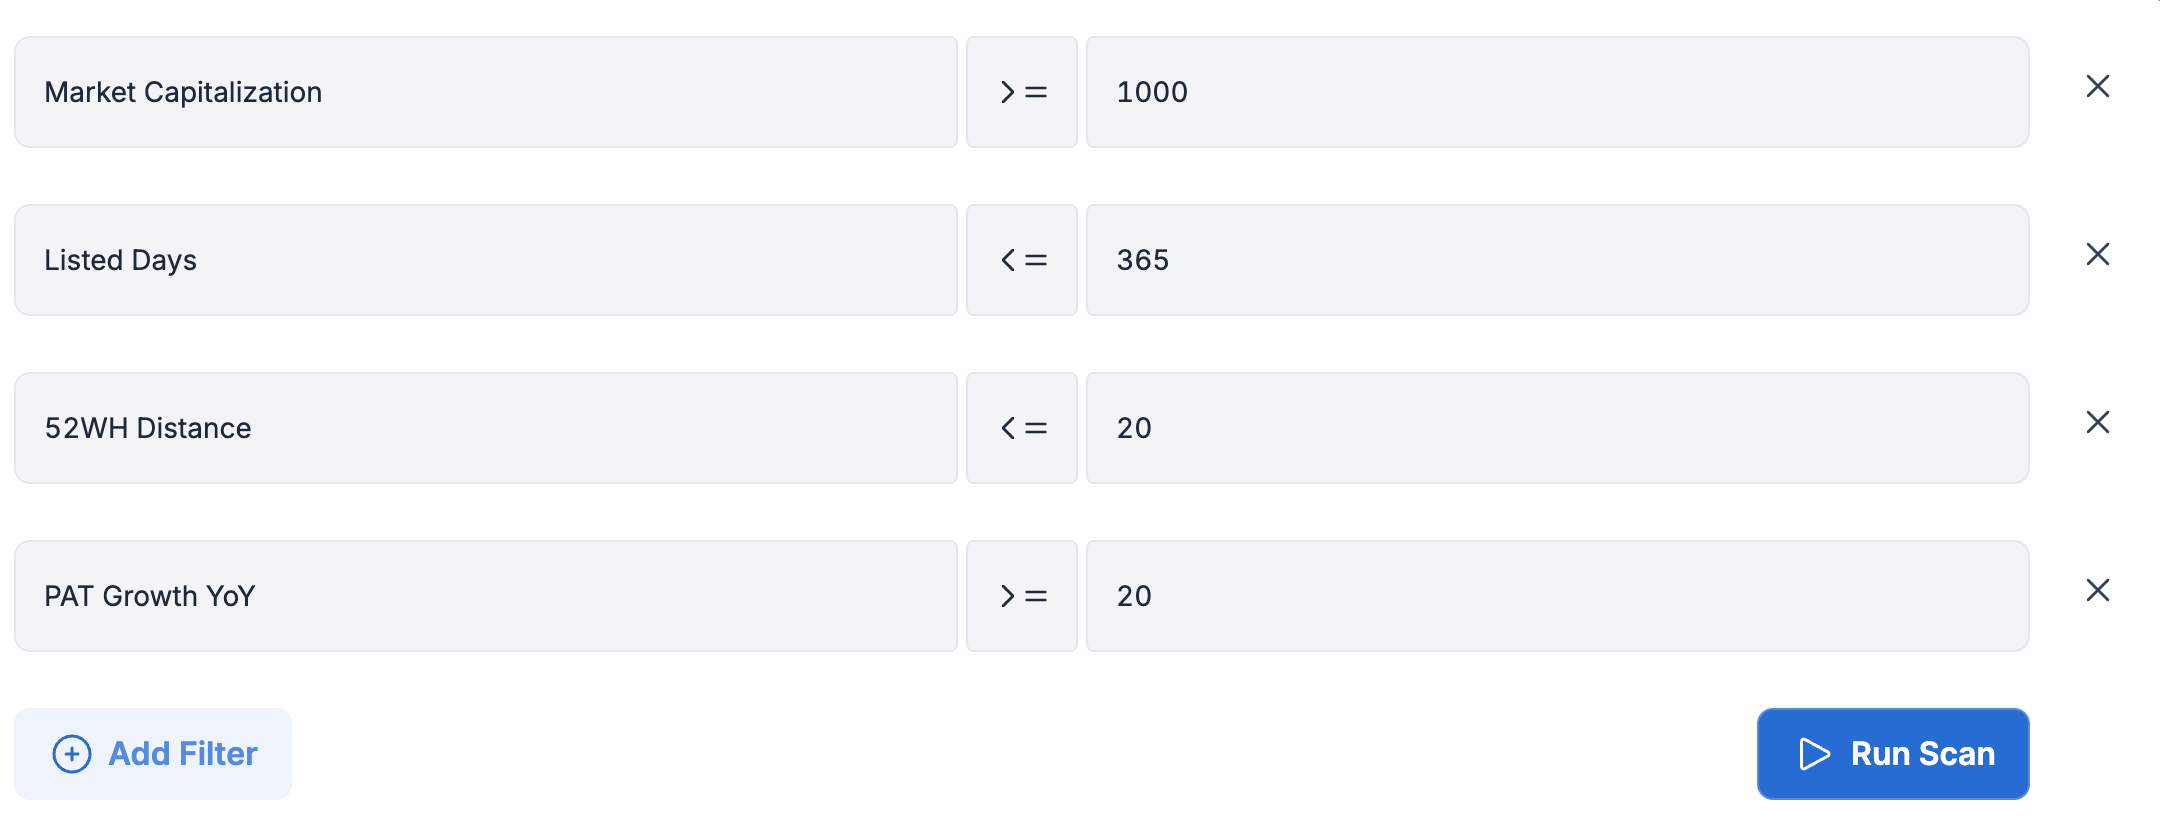
Out of 64 such companies, only 15 met these conditions.
These are not recommendations.
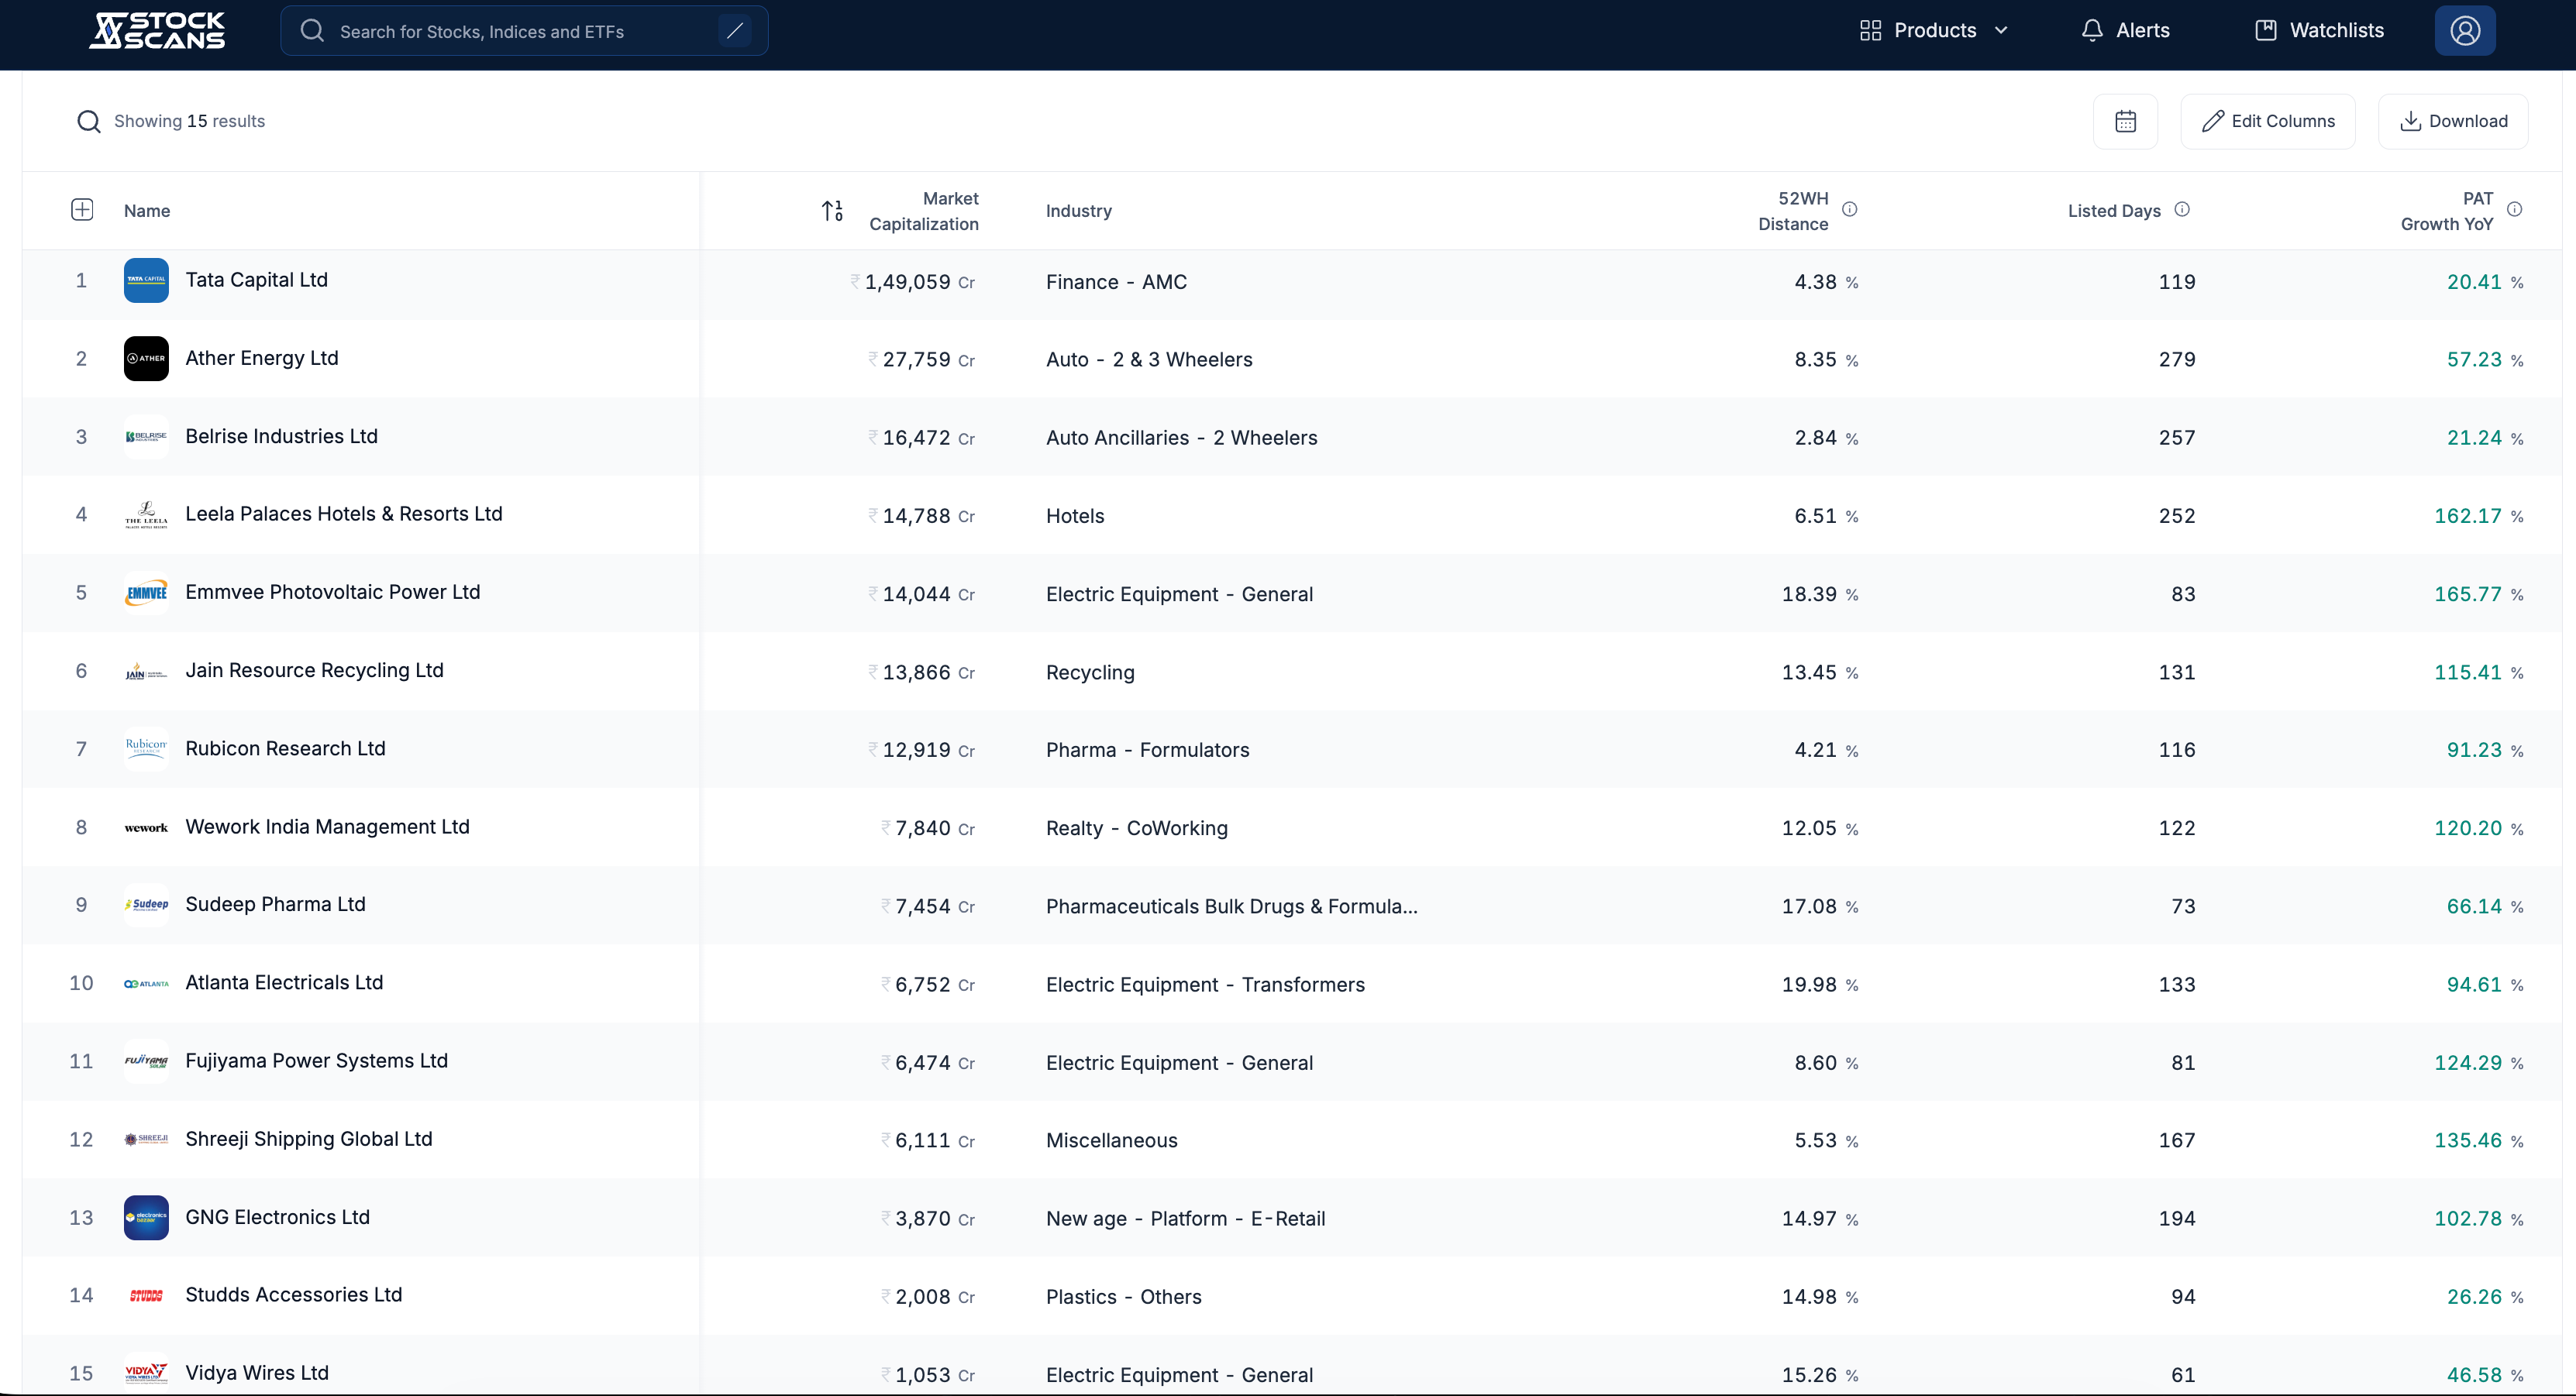
They are early cues of business performance and market behaviour moving together.
The work comes first. The outcome, as always, is left to time.
With that context, we shift to the businesses themselves.
The work begins here.
Let’s start.
1. Belrise Industries
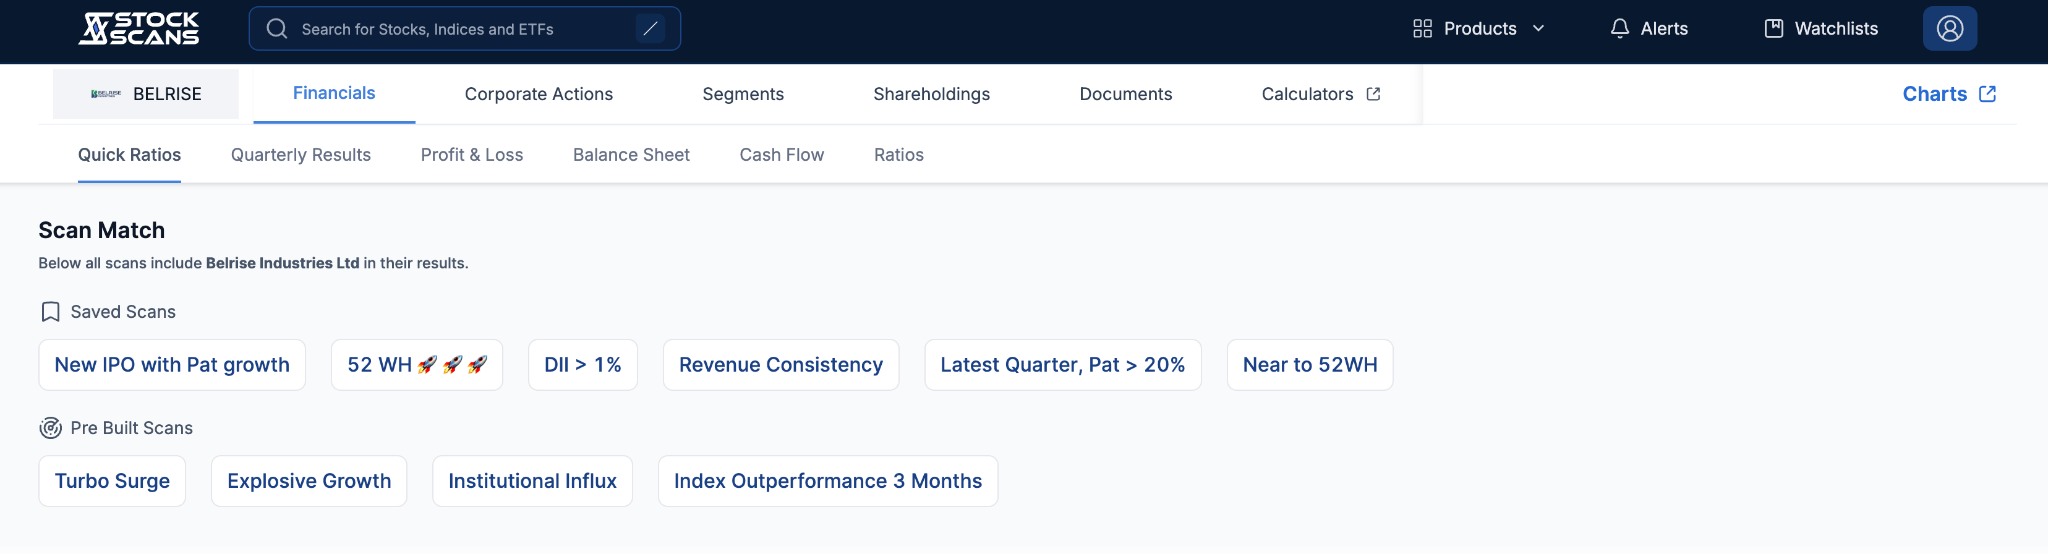
Belrise continues to strengthen its position as a Tier-1 automotive supplier with increasing content per vehicle, deeper OEM relationships, and expansion beyond auto into defence and aerospace. Core growth is driven by higher wallet share with 2W OEMs, EV platform supplies (single-source supplier in Chennai), and premium model ramp-ups. The announced merger of Badve Autocomps and Eximius Infra Tech materially increases scale, vertical integration, and customer stickiness, while being EPS-accretive from day one. Strategic moves into aerospace (SDM acquisition in France) and defence (Plasan partnership) open long-cycle, high-entry-barrier segments.

Manufacturing EBITDA margins remained healthy at ~14%, supported by operating leverage, higher value assemblies (Tier-0.5 shift), and internal RPT eliminations post-merger.
Growth Guidance: Management remains confident of steady automotive growth, incremental gains from EV platforms, and meaningful medium-term contribution from aerospace and defence. The merged entity expects ~₹10 bn incremental revenue with margin uplift over time.
Next Few Quarters – What to Track
Completion and approval of the merger
Ramp-up of Haridwar & EV programs
Initial defence platform production and aerospace scale-up in India
Margin improvement from internal integration
Key Management Quotes
“This transaction will be EPS and value accretive for Belrise shareholders from day one.”
“Our evolution from a Tier-1 to a Tier-0.5 supplier is central to improving margins and customer stickiness.”

The stock remains in an uptrend, trading above its rising 50-day EMA, which continues to act as a key support zone. After a strong move, price has spent time consolidating, indicating digestion of gains rather than a breakdown.
We share every edition of Between the Lines on our Twitter platform.
You can follow the series here: https://x.com/stockscansin
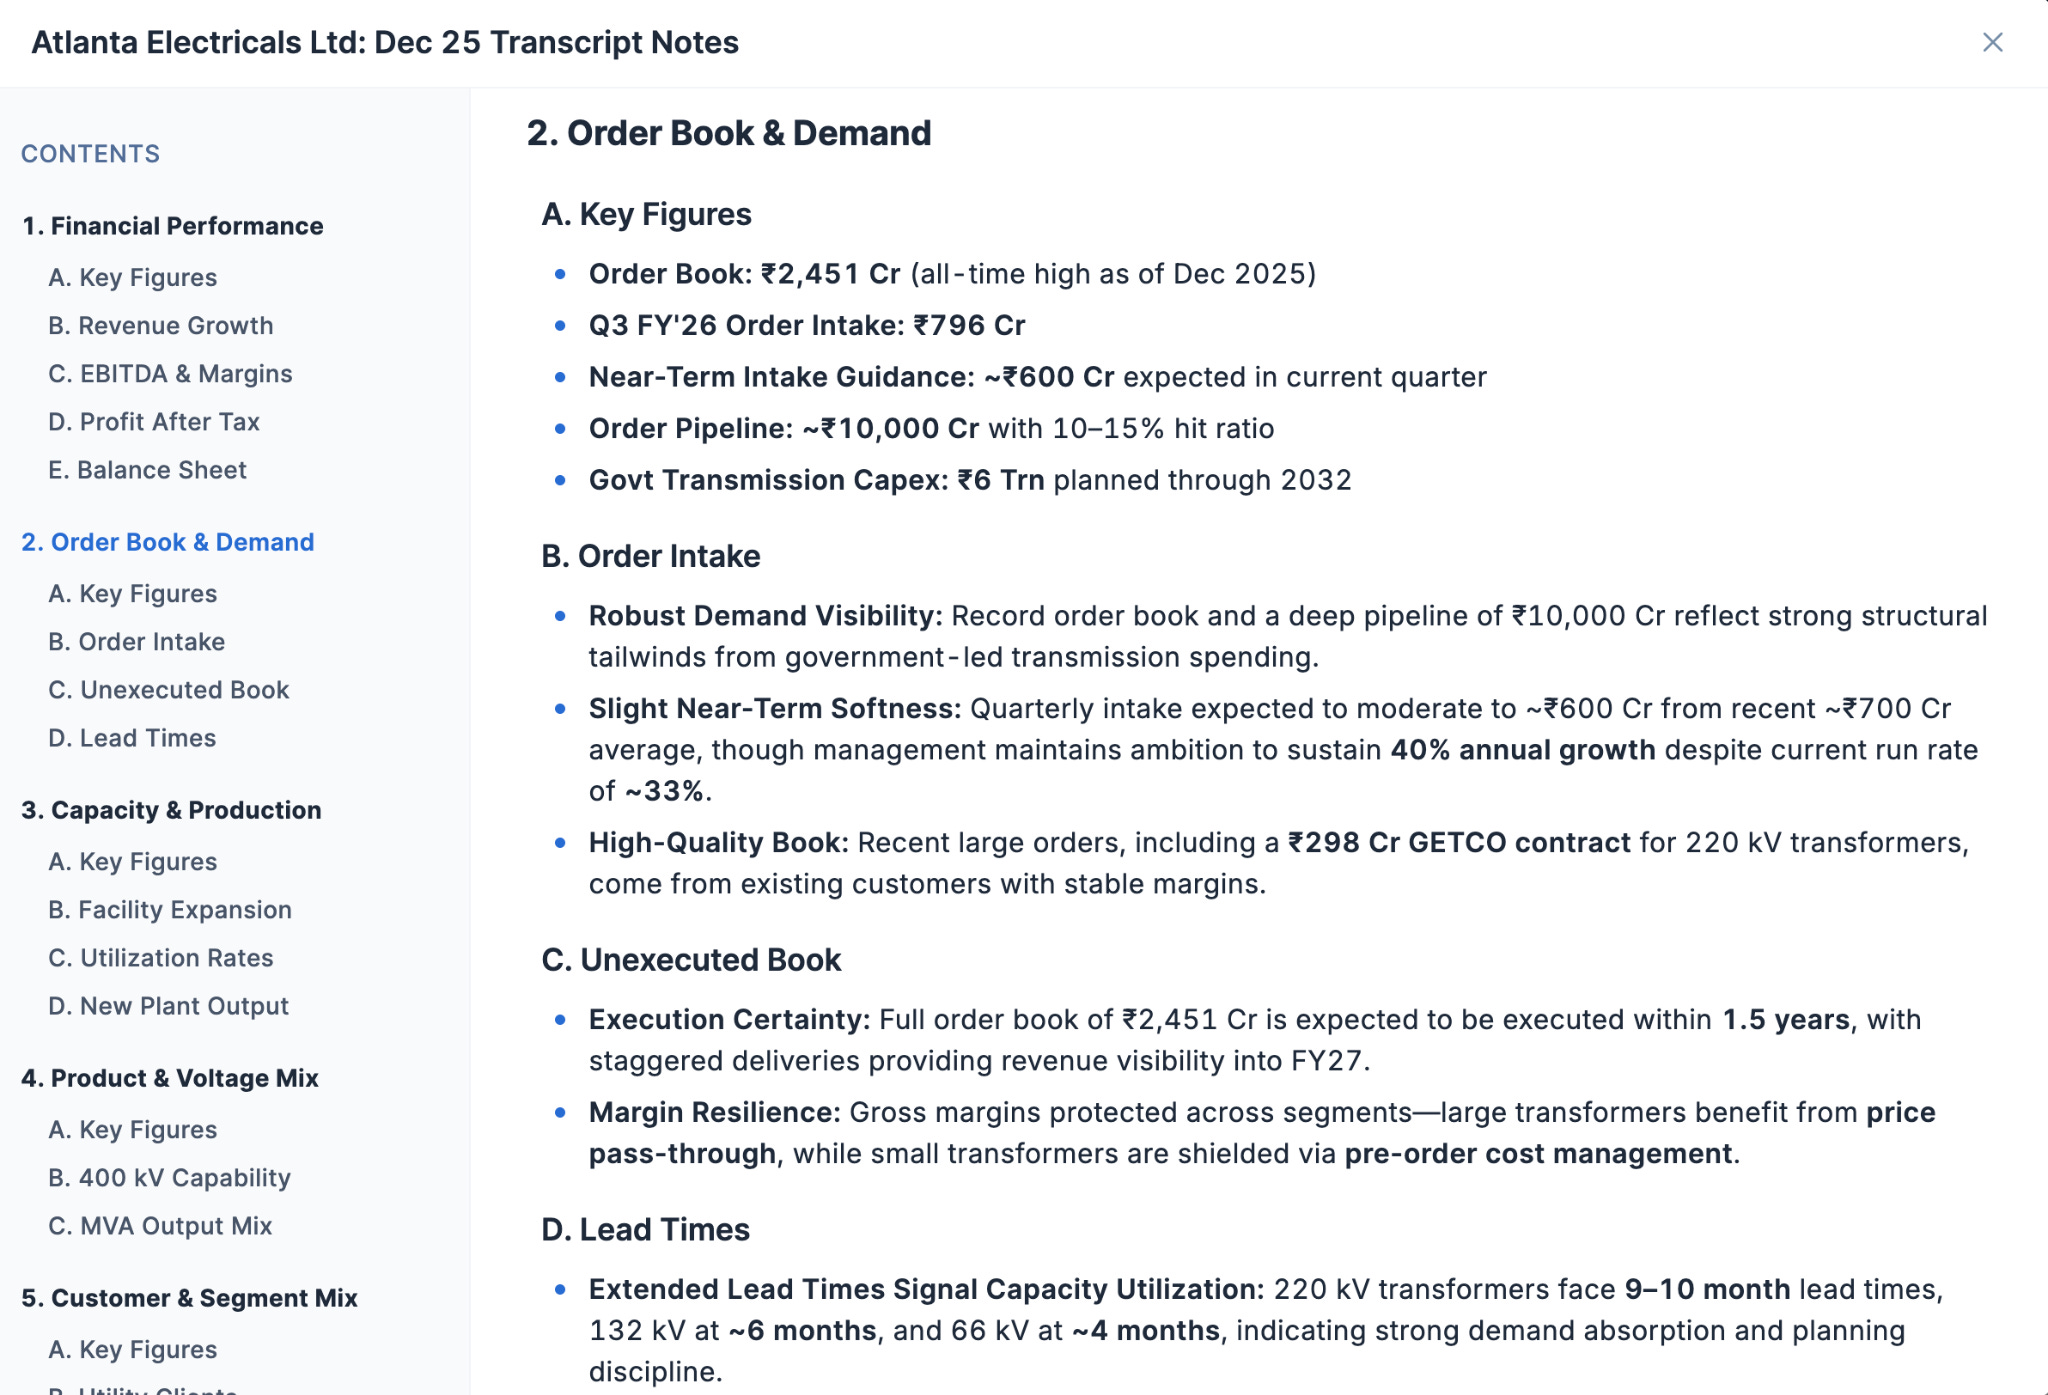
2. Atlanta Electricals
Atlanta is at a clear inflection point, with capacity expansion over the last 18 months now translating into numbers. Transformer capacity expanded nearly 4x (16,000 → 63,000 MVA), enabling entry into high-voltage (400 kV–765 kV) segments that carry structurally superior margins. Demand is driven by India’s transmission bottlenecks, renewable integration, data centers, EV infra, and green hydrogen. The order book stands at an all-time high of ₹2,451 crore, providing strong revenue visibility.

EBITDA margins expanded sharply to 19.4% (+350 bps YoY), driven by operating leverage, better product mix (higher kV share), and procurement efficiencies. Management clearly stated that commodity price volatility is largely pass-through for large transformers, protecting gross margins.
Tariffs / China Risk: Management downplayed risks from potential Chinese participation. Fully built imports remain restricted, qualification cycles are long, and existing Chinese capacity in India is already booked out. Competitive intensity is not expected to change materially in the near term.
Growth Guidance: While avoiding specific volume guidance, management reiterated ~40% YoY revenue growth trajectory with margins expected to remain at current levels due to higher voltage mix.
Next Few Quarters – What to Track
Sustained execution of record order book
Ramp-up of EHV segment contribution
Export order scaling
Stability of EBITDA margins near ~18–20%
Key Management Quotes
“The investment phase is largely behind us; the next phase is operating leverage and utilisation.”
“Higher voltage classes are structurally less competitive and deliver better margins.”
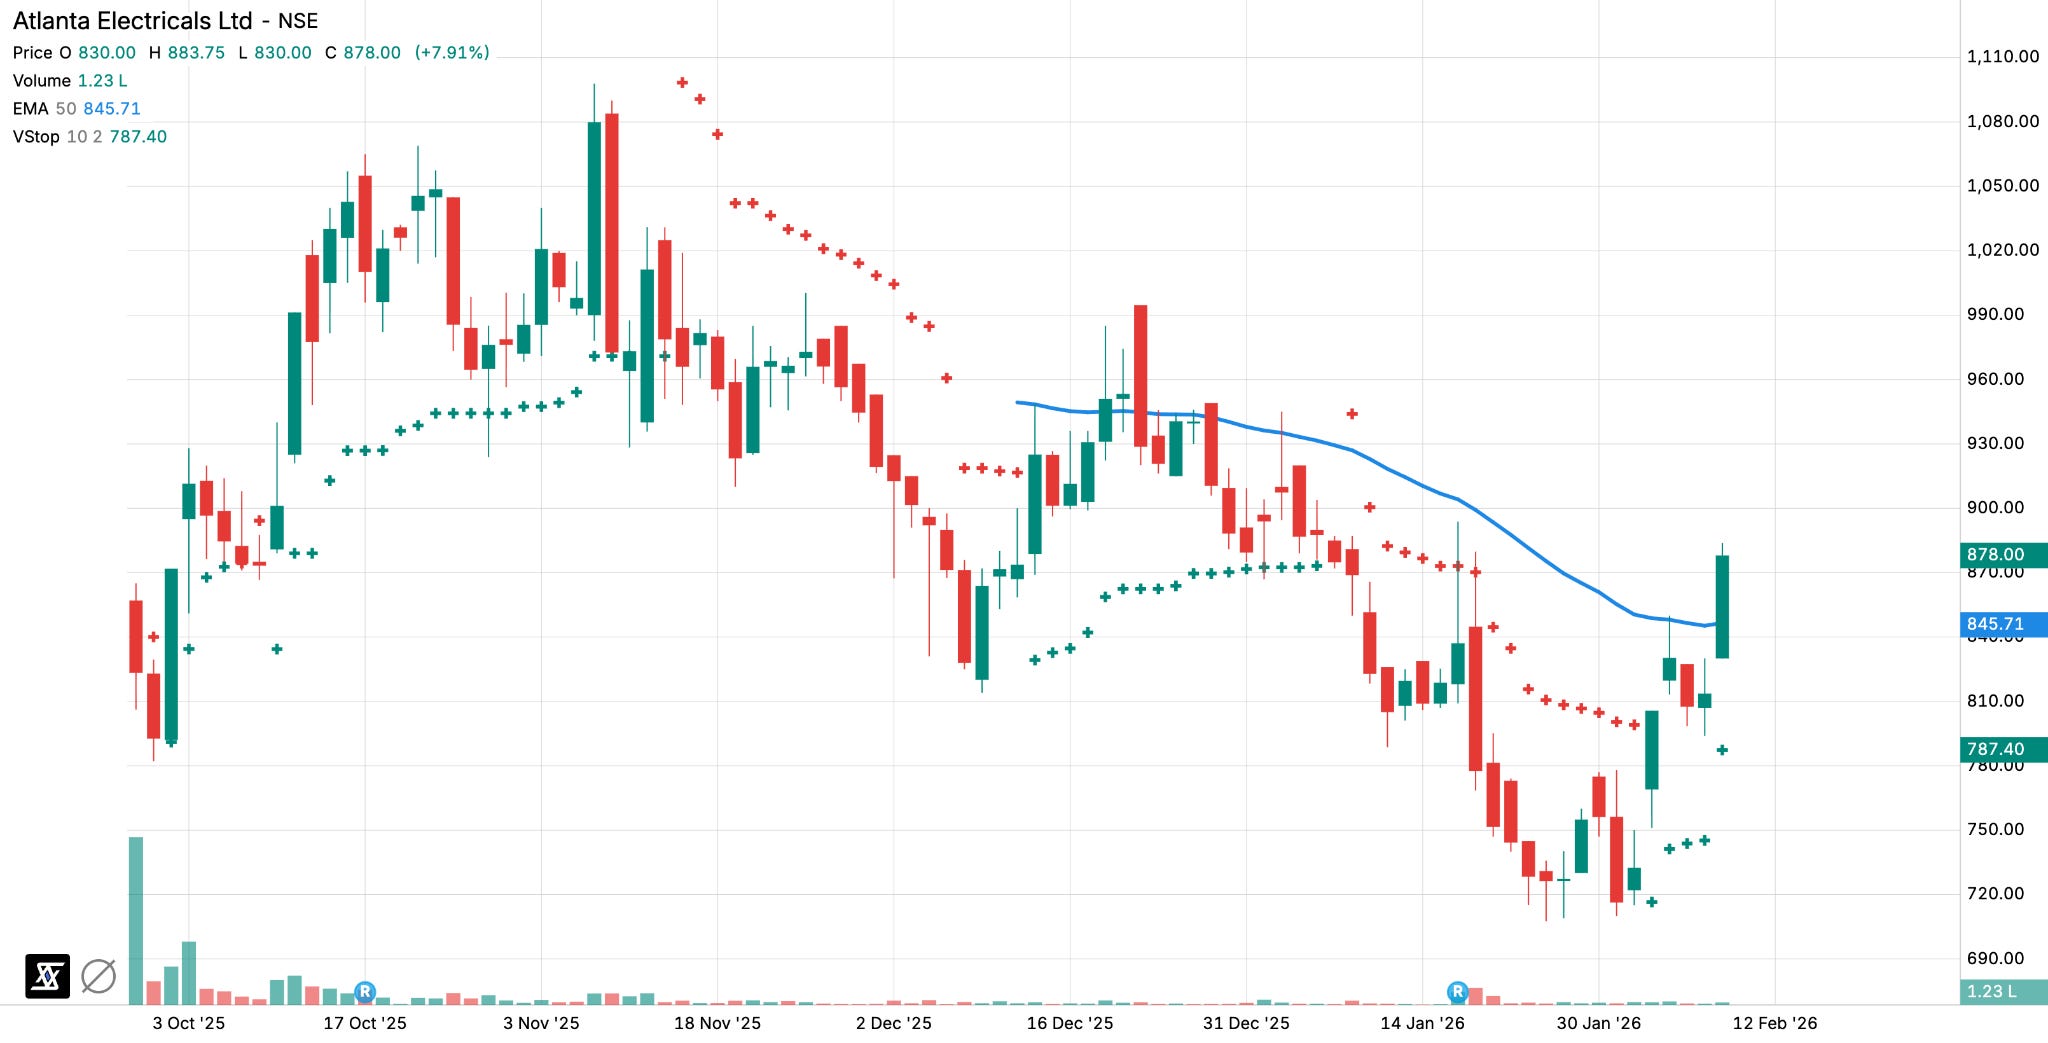
The stock is attempting a trend recovery after a corrective phase, with price moving back above short-term supports. It is currently trading around the 50-day EMA, which acts as an important pivot zone.
3. Leela Palaces Hotels & Resorts:
Leela continues to significantly outperform the luxury hospitality segment, driven by strong ADR growth, premium positioning, and a holistic luxury ecosystem spanning rooms, F&B, wellness, and experiences. Q3 saw 20% RevPAR growth and best-ever EBITDA margins, supported by the successful repositioning of properties (notably Jaipur) and strong demand across city and resort hotels.
Operating EBITDA margins reached ~52%, among the best in the industry, aided by operating leverage, cost optimisation, energy efficiency, and high incremental revenue conversion (>60%). Management reiterated confidence in sustaining mid-to-high teens EBITDA growth over the next few years.

Leela is pursuing capital-efficient, asset-light growth. New signings (Mumbai BKC, Dubai, Jaisalmer) and a pipeline of 9 hotels (~1,000+ keys) underpin long-term growth, targeting ₹2,000 crore EBITDA by FY30. Strong ADR growth (~17%) highlights pricing power.
Growth Guidance: Management is confident of sustained RevPAR and EBITDA growth, driven by ADR expansion, occupancy improvement, F&B scaling, and new luxury destinations.
Next Few Quarters – What to Track
Stabilisation of new hotels (BKC, Jaisalmer)
Continued F&B growth trajectory
Asset-light deal announcements
Margin sustainability above 45–50%
Key Management Quotes
“This was our best-ever quarterly performance and the fifth consecutive quarter of double-digit RevPAR and EBITDA growth.”
“India’s luxury segment is entering a multi-decadal growth phase, and we are uniquely positioned to benefit.”
Before moving to the next company, it helps to zoom out and see the broader earnings backdrop.

Looking at the Nifty Smallcap 250 Index, the ongoing earnings season shows a moderation in median growth compared to the peaks seen in late FY23 and early FY24. Revenue growth has remained relatively stable, while operating profit and PAT growth have softened, reflecting a more selective earnings environment rather than a broad-based surge.
4. Ather Energy
Ather delivered a breakout operating quarter, driven by strong demand for Rizta, rapid distribution expansion, and deepening software monetization. Unit sales grew ~50% YoY to ~68k units, with pan-India market share reaching ~19%. Growth is no longer limited to southern markets — Middle India (Maharashtra, MP, Gujarat, Odisha) is emerging as the biggest incremental growth engine. Non-vehicle revenues (software, charging, services) are becoming a meaningful contributor, improving unit economics and customer stickiness.

Gross margins improved sharply to ~25% (+700 bps YoY), while EBITDA losses narrowed dramatically to ~-3%, reflecting operating leverage + fixed cost.
Capex is focused on distribution expansion (600 → 700 stores), charging infrastructure (~5,000 fast chargers), and product readiness for the EL platform. Manufacturing for EL is planned at AURIC, with flexibility to start initial volumes from Hosur to de-risk timelines.
Growth Guidance: While no formal volume guidance was given, management expects to exit FY26 in a significantly stronger EBITDA position. EL launch later in the year is positioned as the next growth leg, enabling lower entry price points without margin sacrifice and unlocking North & East India.
Next Few Quarters – What to Track
EL platform launch & pricing strategy
Further EBITDA break-even progress
Growth in software / non-vehicle revenue mix
Distribution expansion beyond 700 stores
Key Management Quotes
“In just three quarters of FY26, we have already improved EBITDA by more than what we did in the entire FY25.”
“Non-vehicle revenues and software are a structural advantage for Ather and will keep compounding.”
5. Emmvee Photovoltaic Power
Emmvee delivered a strong execution-led quarter, supported by capacity ramp-up and a robust order book. Revenues more than doubled YoY, with EBITDA margins remaining industry-leading. Module capacity expanded to 10.3 GW, and the company secured a 9.3 GW order book, including a large 4.5 GW multi-year TOPCon cell order, providing long-term visibility.
EBITDA margins stayed strong at ~36%, driven by integrated operations, technology improvements, and operating discipline. Management emphasized that absolute EBITDA per watt is the key metric (not percentage margins), which remains stable despite fluctuations in module prices.

Capex: The company commissioned a 2.5 GW module line and acquired land for a 6 GW integrated cell + module facility at Devanahalli, with funding fully tied up. The strategy is to move deeper into integration, ensuring cost control, supply security, and long-term competitiveness.
Pricing / Tariffs / China Risk: Most contracts are pass-through, insulating margins from raw material volatility (silver paste, aluminium). Technology improvements have already reduced silver consumption materially, with further scope ahead. Management downplayed China pricing risk, noting that global price dynamics rarely translate into sustained pressure for Indian integrated players.
Growth Guidance: Capacity utilization will scale gradually, with modules typically peaking at ~60–65% utilization and cells at ~85–90%. Demand visibility remains strong for the next 12–18 months, backed by confirmed, financed orders.
Next Few Quarters – What to Track
Ramp-up of new module lines
Progress on Devanahalli integrated facility
DCR vs non-DCR mix evolution
Stability of EBITDA per watt metrics
Key Management Quotes
“Don’t look at percentage margins - absolute EBITDA per watt is what matters, and that remains very strong.”
“Our contracts are largely pass-through, so raw material volatility does not structurally hurt margins.”
6. WeWork India
WeWork India continues to scale as a profitable, demand-led workspace platform, not just a flex office provider. Occupancy reached a record ~84%, with occupied desks up ~30% YoY. Revenue grew ~27% YoY to ₹640 crore, supported by higher utilization and price resilience. Managed Offices have emerged as a powerful growth engine, now contributing ~21% of revenue with zero speculative risk. EBITDA margins expanded to ~21%, driven by operating leverage, cost discipline, and mix improvement. PAT surged more than 5x YoY, and ROCE touched ~33%, among the highest across real-estate-adjacent platforms. Strong cash generation enabled self-funded growth.

Capex: Average capex stood at ~₹1.5 lakh per desk (higher this quarter due to enterprise customization). Net debt reduced sharply, borrowing costs declined, and credit rating improved significantly, strengthening financial flexibility.
Rent inflation remained modest, while operating costs per square foot declined, reflecting scale benefits. Managed Office projects are executed only against committed demand, ensuring predictable returns.
Growth Guidance: Pipeline visibility is strong, with ~40% of future capacity already tied to signed leases/LOIs. Total capacity is expected to rise from ~8.2 msf to ~10.3 msf by FY27. Managed Office revenue share is expected to trend toward ~30% over the next 24 months.
Next Few Quarters – What to Track
Occupancy sustainment above 80%
Managed Office deal wins and execution
Free cash flow consistency
Capex discipline vs expansion pace
Key Management Quotes
“We are no longer just growing — we are growing profitably with capital discipline.”
“Managed Offices are executed only against committed demand, ensuring immediate utilisation.”
Before closing this edition, we did one simple - yet very interesting exercise.
We looked at businesses that were recently listed, have reported their Q3 FY26 results, are trading near their 52-week highs, and have delivered at least 20% year-on-year PAT growth.
That short exercise itself narrowed the universe meaningfully and left us with a small, focused set of companies. From there, we went a step further - reading concalls, understanding what’s changing inside the business, and observing how the market is responding.
You can apply the same scanning framework for different use cases - result seasons, new listings, sector rotations, or even portfolio reviews. The method stays simple; only the lens changes.
We hope you’re enjoying this journey of Between the Lines.
If this edition resonated with you, do let us know by dropping a comment below:
“StockScans team mazza aagya”
(Yes, that’s our favourite 😄)
Thanks for reading.
Disc: Not a Buy/Sell Recommendations.